The Impact of Teacher Leaders on Students' Achievement In Science
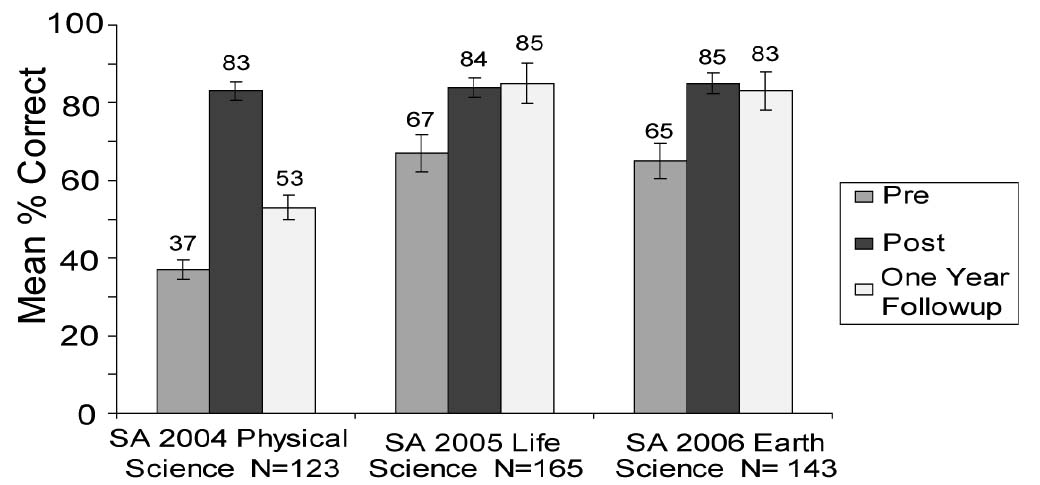
Figure 1 below illustrates the development and retention of TLs' content knowledge due to their participation in NCOSP SAs, as measured by pre-, post-, and delayed post-tests.
Figure 1: Increases in Teacher Leader content
knowledge resulting from 2004, 2005 and 2006 NCOSP Summer Academies. (95% Confidence
Intervals bars shown).

On surveys at the end of each NCOSP SA, teachers responded to "retrospective" questions in which they rated their understandings before and after the academy in a number of areas that reflect the important aspects of effective instruction (Bransford et al., 2000). The results in Table 1 below suggest that each SA helped increase teachers' understanding of effective teaching and learning in science. Additionally, there was a significant increase over the three SAs in the percentage of teachers beginning the SA with a clear understanding of effective teaching and learning in science.
Table 1: Inservice teachers' responses to a survey administered at the end of each Summer Academy.
Rate your understanding of the topics below both BEFORE and AFTER your Summer Academy (SA) experience. | % Clear to Very Clear Understanding | |||||
SA
2004 | SA 2005 | SA 2006 | ||||
How to elicit students' thinking | 46 | 90 | 68 | 92 | 70 | 98 |
How to help students construct their understandings | 49 | 91 | 60 | 90 | 66 | 96 |
How students learn science | 59 | 95 | 79 | 98 | 81 | 99 |
My own learning process | 72 | 98 | 87 | 99 | 90 | 100 |
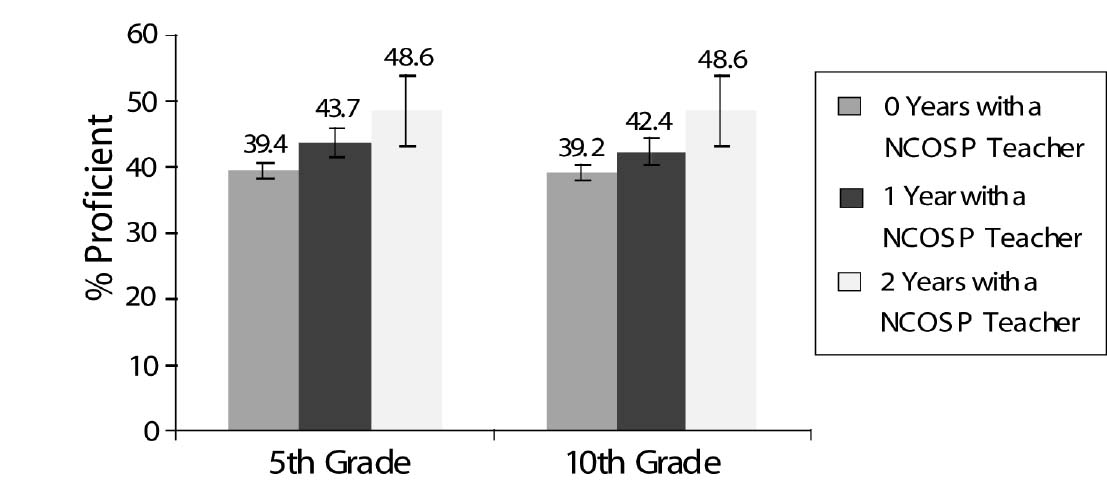
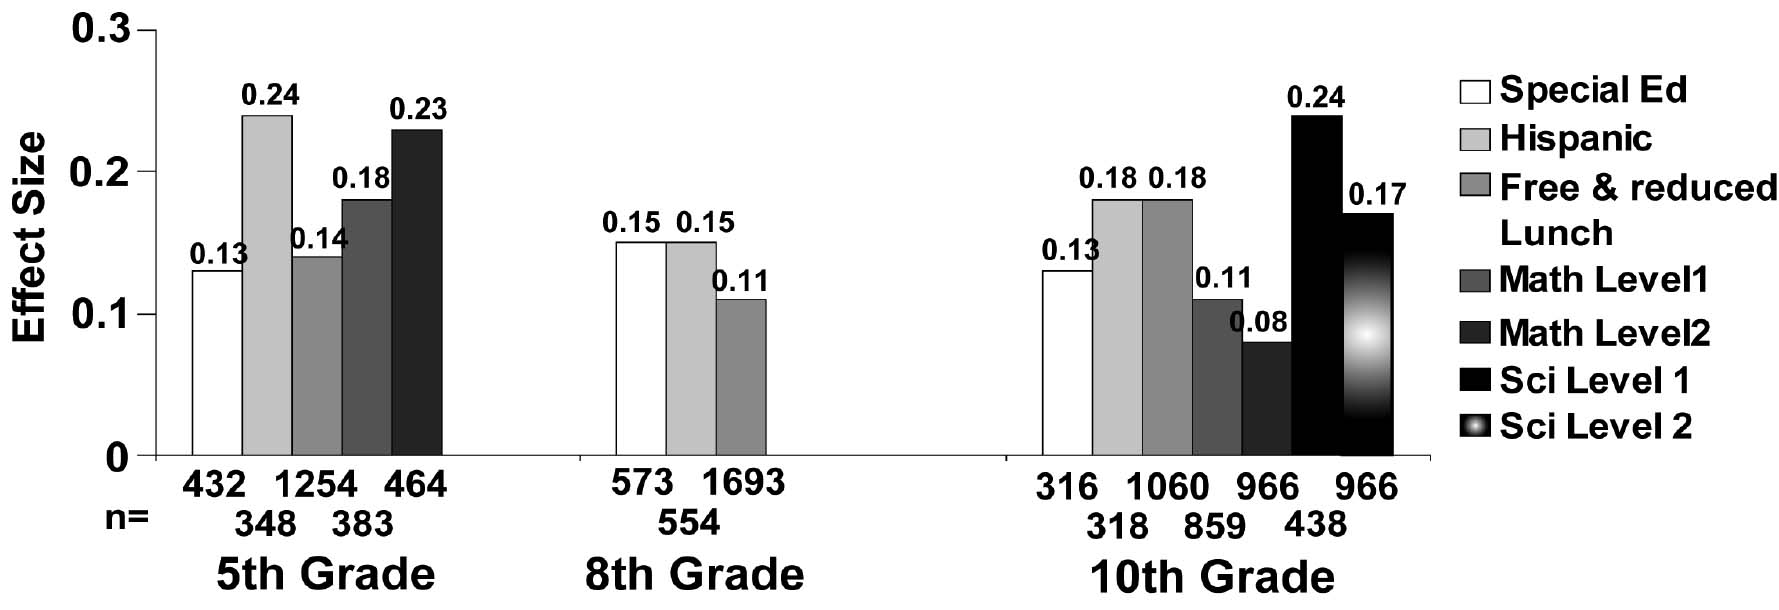
These increases in NCOSP teacher leaders' content knowledge and understanding of effective instruction have had positive impacts on the science achievement of their K-12 students, particularly for those students who had a teacher leader for more than one year (Figure 2). We also observed differential benefits for various subgroups of students (e.g., Special education, Hispanic, students qualifying for Free/Reduced lunch program). These students tested significantly higher on the Washington Assessment of Student Learning (WASL) in science when taught by NCOSP teacher leaders (Figure 3).
Figure 2: Students with more contact
with NCOSP Teacher Leaders show significantly higher levels of proficiency on the science
WASL in 5th and 10th grade.

Figure 3: In 2005 through
2007 several subgroup populations scored higher with NCOSP Teacher
Leaders. (Positive effect sizes indicate higher test scores from students
with teacher leaders).


